Please note: You are viewing the unstyled version of this website. Either your browser does not support CSS (cascading style sheets) or it has been disabled. Skip navigation.

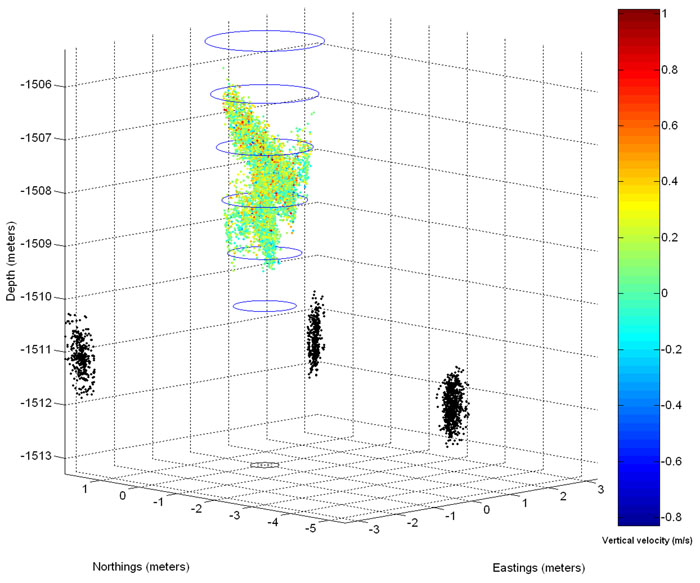
Image : WHOI-Led Study Sharpens Picture of How Much Oil and Gas Flowed in Deepwater Horizon Spill

   Print Change text to small (default) Change text to medium Change text to large


3D reconstruction of a hydrocarbon jet leaking from the Deepwater Horizon's  broken riser. Each colored dot represents the location of an acoustic Doppler velocity measurement, with the dot color describing the velocity. The black ellipse indicates the size and location of the jet source; blue dashed ellipses indicate the jet flow perimeter. Black dots indicate the position of the ROV-mounted Doppler sonar during the measurement sequence. (Illustration courtesy of Rich Camilli, Woods Hole Oceanographic Institution)

[back]


Last updated: July 28, 2014


whoi logo

Copyright ©2007 Woods Hole Oceanographic Institution, All Rights Reserved, Privacy Policy.
Problems or questions about the site, please contact webdev@whoi.edu
Contact | Site Map | Support WHOI Research
WHOI Facebook WHOI You TubeWHOI Twitter